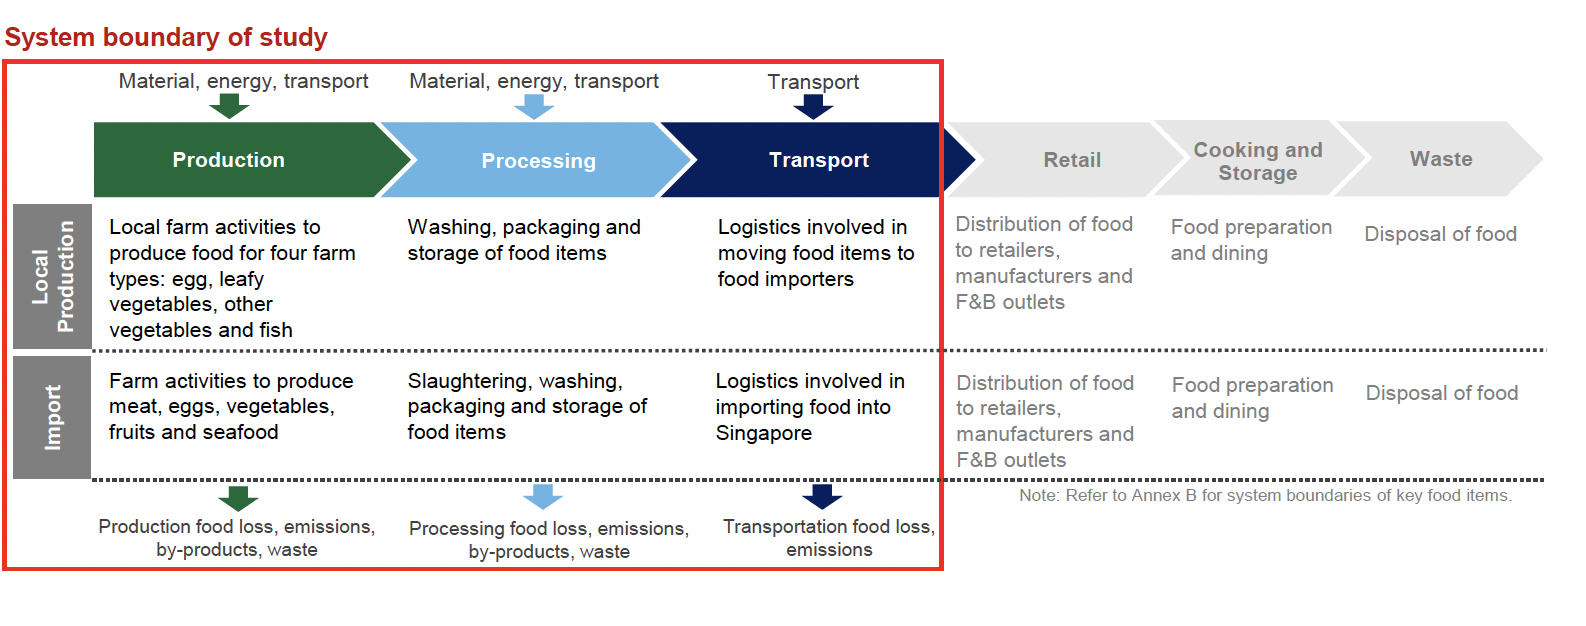
WEEK 3
SEM 2
DATA VISUALISATION

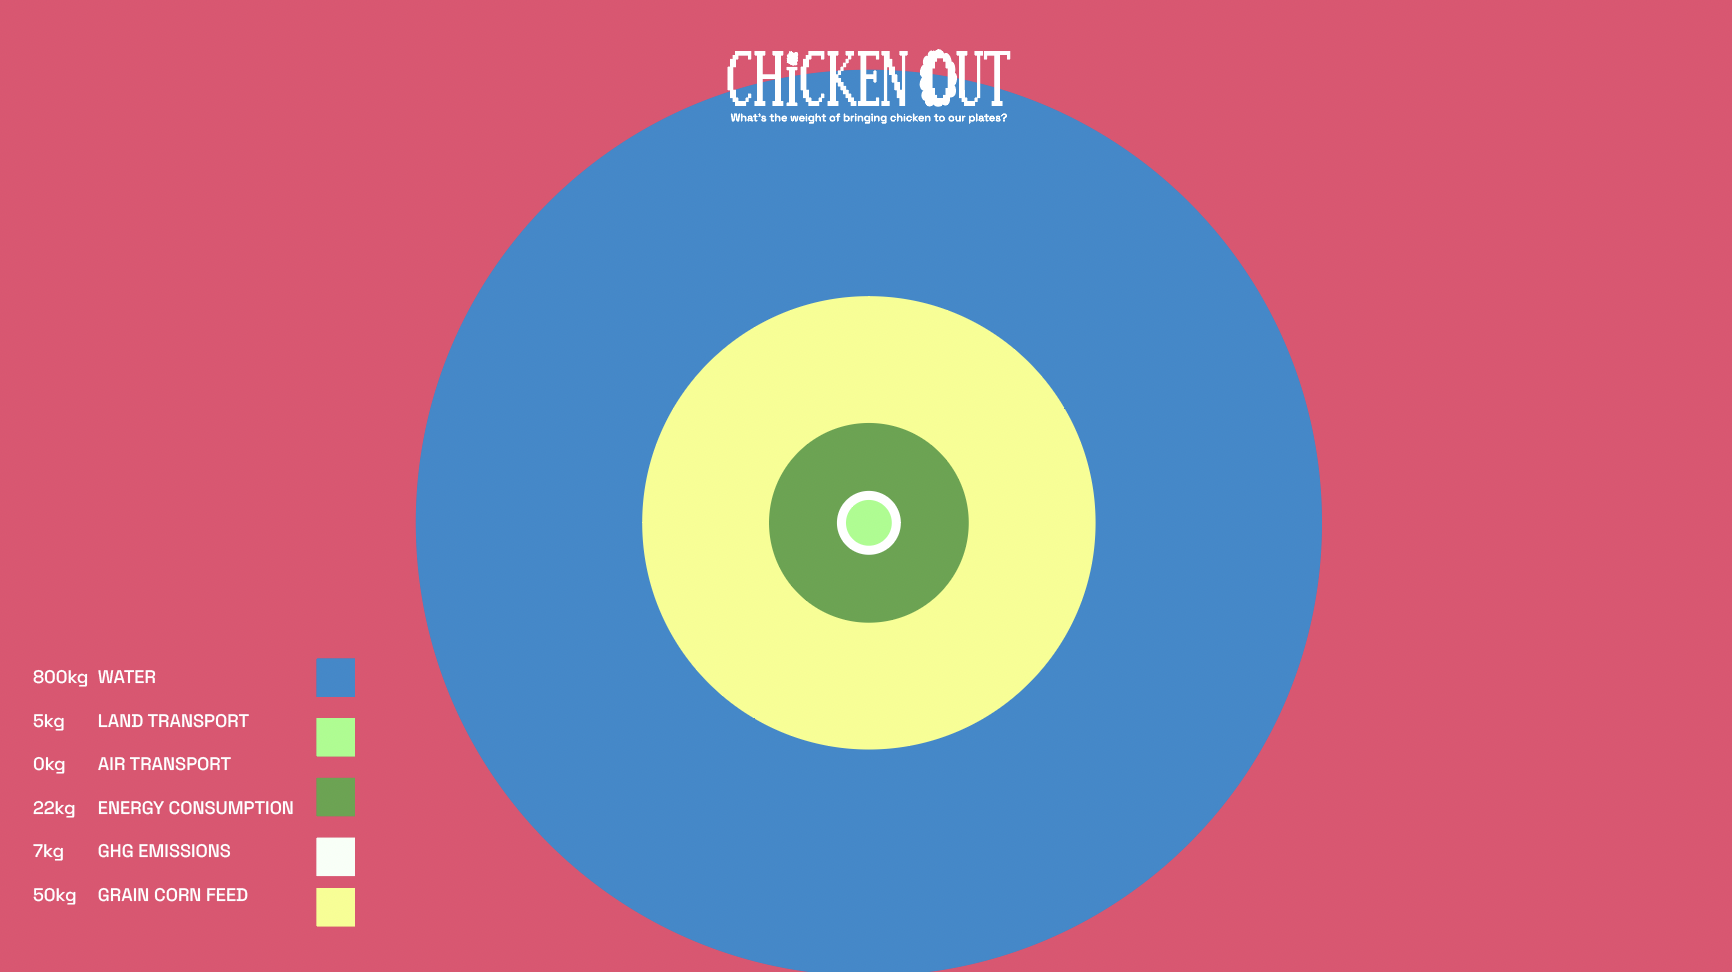
ACCURATELY DEPICTING INFORMATION AND DATA
-3 COLUMN DIFF TYPES OF CHICKEN
-DATA ON VARIOUS FARMS
CHICKEN AS A SIGNIFIER
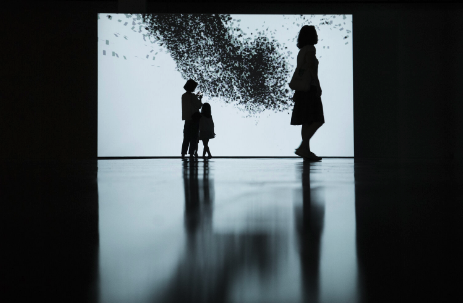
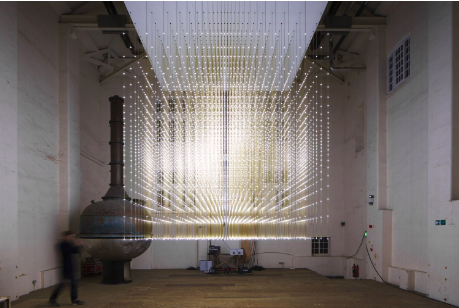
Andreas also asked about what I would do to prevent someone from wasting food. I said I would pressure people into eating by using other people to stare at the person wasting food. I was prompted to explore this further. I was also keen to explore indication of food wastage through a weight sensor and blinking lights to pressure people in an eating space.
He also advised about how not including surveys in my dissertation just because they are easy to create. Hence, it may be better to focus on critical sources, ones from people experienced in this food field.
